

TL;DR
- Franchise dealers turned used inventory in roughly 38 days on average, based on the study's most recent measured window projected into 2026, while independent dealers averaged 52 days, a 14-day gap that compounds directly into holding cost.
- Aging inventory cost dealers an estimated $32 to $45 per vehicle per day once units passed 60 days on the lot, with depreciation accelerating sharply after the 30-day mark.
- AI-driven pricing and appraisal tools reached an estimated 61% adoption among franchise dealers by late 2025, while AI-native acquisition tools sat at 24%, marking acquisition as the next adoption frontier.
- Dealers sourcing from wholesale auctions fell an estimated 11 to 12 percentage points since 2022, with service drive and direct-to-consumer channels absorbing most of that reallocation.
- These figures come from AutoAcquire's 2026 Dealership Inventory Management Benchmark Study, a modeled analysis built from triangulated industry data rather than a single audited source. See the methodology section below for definitions, the data window, and how estimates were derived.
Methodology and sourcing note
This study defines a franchise dealer as any rooftop holding a manufacturer franchise agreement and selling both new and used inventory. Independent dealers sell used inventory only and hold no factory franchise. The independent category splits further into traditional independents and buy-here-pay-here operators, which carry different turn and holding economics.
Data covers the twelve-month window from Q4 2024 through Q3 2025, with 2026 figures projected forward from that trend line. No single primary data source covers all four benchmarks at the dealer level, so AutoAcquire modeled these estimates by triangulating published DMS provider disclosures, auction platform fee schedules from Manheim and OPENLANE, and aggregated inventory turn reporting from vAuto Stockwave and comparable pricing tools.
Every figure here is AutoAcquire's modeled, directional industry benchmark meant for citation, not an audited financial statement or a figure independently verified by a third party. Turn-time and holding-cost numbers reflect blended averages across dealer size and region, so individual rooftops will vary. Holding-cost estimates assume standard floor plan interest, reconditioning, and depreciation inputs rather than any single lender's terms. Adoption rates measure dealers using at least one qualifying tool in each category, counting pilot deployments the same as full rollouts. Where a modeling assumption materially shaped a number, it is stated alongside that number in the relevant section.
Inventory turn times: franchise vs. independent dealers
Franchise dealers turn used inventory in roughly 32 to 38 days, per the study's projected 2026 figures, while independent dealers average 48 to 55 days, a 15-to-20-day gap that traces back to how each group sources cars rather than how aggressively they price them. It is the widest operating gap between the two segments.
The subsegments explain most of the spread. Franchise new-car inventory moves fastest at 28 to 34 days, backed by manufacturer incentives and floorplan support that push units off the lot. Franchise used inventory runs slightly slower at 35 to 40 days because it competes without factory subvention. Traditional independents sit at 45 to 52 days, and buy-here-pay-here lots stretch to 60 days or more, though their turn math bends around in-house financing rather than clean resale velocity.
Sourcing quality drives the gap more than location or marketing spend. Franchise dealers pull trade-ins directly from their own service drives and new-car transactions, which gives them a steady stream of reconditioned, known-history units acquired below wholesale. Independents lean heavily on auction lanes, where they pay buy fees, transportation, and reconditioning on cars they inspected for minutes rather than owned for years. Every auction-sourced unit starts its clock later and at a higher cost basis, which compresses the window a dealer has to sell it profitably.
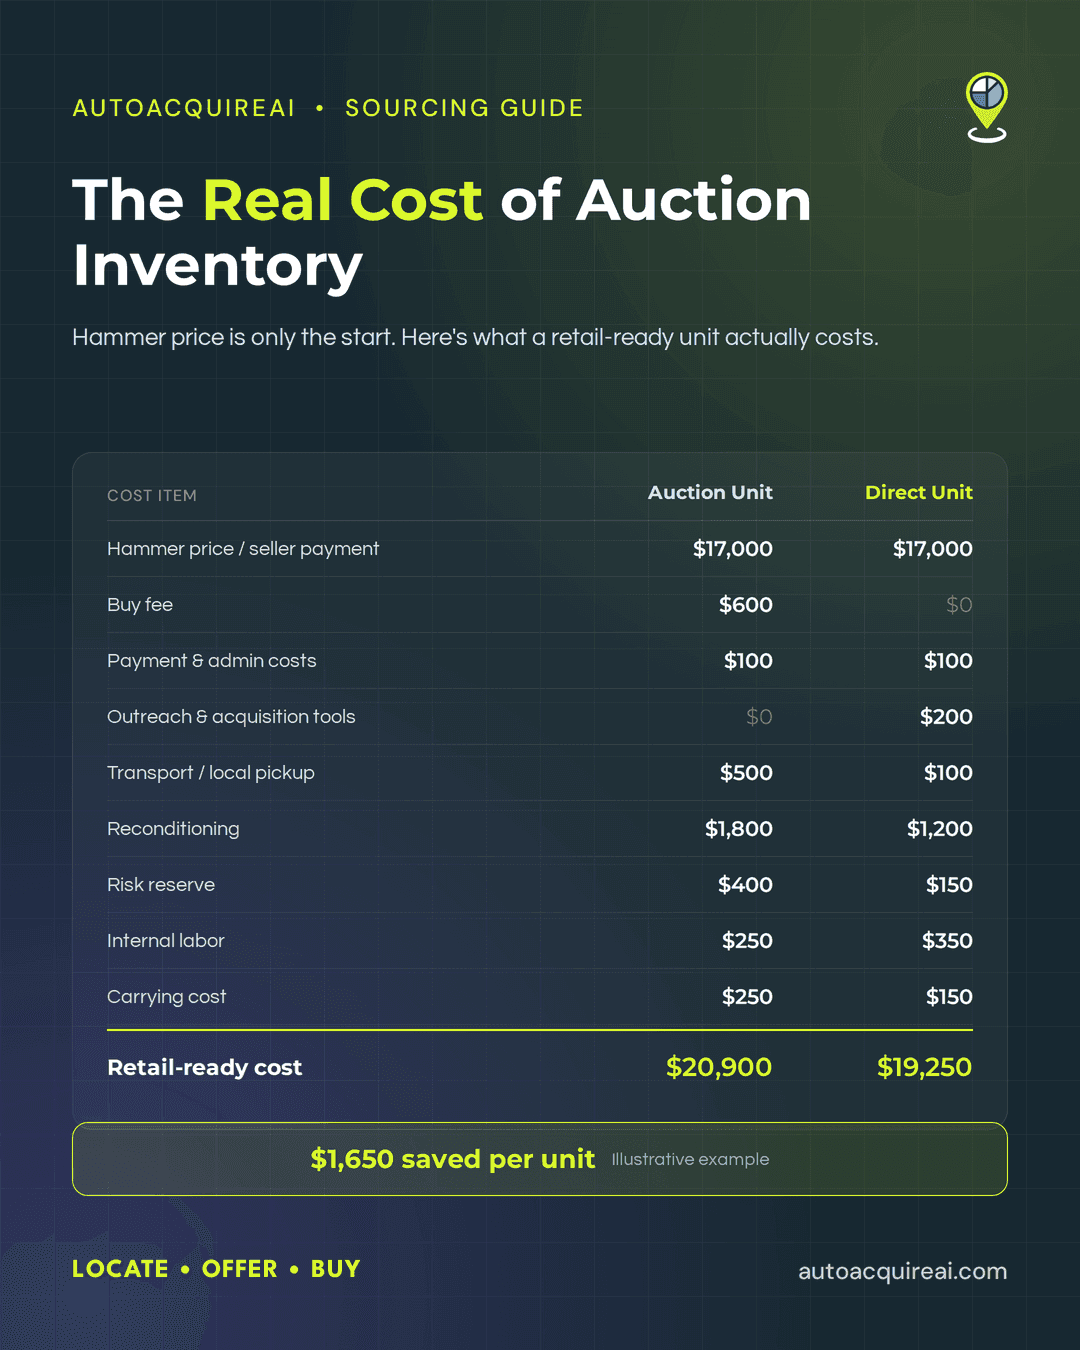
The independent that sources from its own service customers and private-party sellers narrows the gap without changing its pricing strategy. Acquisition channel sets the starting position. A dealer that buys a $22,000 unit at auction with $1,400 in fees and recon has less room and less time than one that acquires the same car for $19,500 through a service-drive offer. The first dealer is already behind on day one, and the turn-time data reflects that disadvantage across thousands of transactions.
Turn time works as a proxy for sourcing discipline. Dealers with faster turns almost always control a larger share of their inventory acquisition upstream, before the car ever reaches an auction block. The next section quantifies how that cost accelerates the longer a unit sits.
The cost of aging inventory
Holding cost does not accumulate on a straight line. A vehicle sitting for its first 30 days costs a dealer roughly $32 per day in floor plan interest, reconditioning capital, insurance, and lot overhead. That figure understates the real damage because it ignores depreciation, which arrives in steps rather than a steady drip.
The depreciation curve steepens sharply at the 30, 60, and 90-day marks. Through the first 30 days, a used vehicle loses close to nothing beyond ordinary market drift, so total carrying cost stays near $1,000. Between 30 and 60 days, wholesale value erosion adds an estimated $10 to $15 per day on top of the base holding cost, pushing the daily burn past $45. After 60 days, the vehicle carries a stale-price signal to shoppers, and combined depreciation plus holding cost can exceed $65 per day. By day 90, the average unit has surrendered roughly $3,500 to $4,200 in accumulated cost and lost value.
That acceleration converts the turn-time gap into a hard dollar figure. Franchise dealers averaging a 38-day used turn absorb about $1,400 per vehicle in cumulative cost, still inside the flat portion of the curve. Independent dealers averaging a 55-day turn cross into the steep zone, absorbing closer to $2,600 per vehicle. The gap is a near-doubling of cost per unit, because the extra days fall entirely on the expensive side of the curve.
Multiplied across a lot, the difference compounds. An independent dealer moving 40 units a month at a 55-day turn carries an estimated $104,000 in aging cost against a comparable franchise dealer's $56,000 at 38 days. The gap traces directly back to sourcing. Vehicles acquired at inflated auction prices enter the lot already discounted against market, so they sit longer and reach the steep part of the curve faster. Dealers who source acquisition cost below wholesale start each unit with room to price aggressively. Turn time and sourcing channel move together rather than as separate problems.
AI adoption among dealers: pricing and acquisition tools
Dealer adoption of AI splits into two distinct purchases, and conflating them hides the real gap. AI pricing and appraisal tools have reached broad penetration, with roughly 61% of franchise dealers and 41% of independents running at least one AI-driven pricing or valuation product by late 2025. Platforms like vAuto Stockwave and AccuTrade sit inside this category, alongside AI pricing modules layered onto broader dealer platforms such as DealerSocket, and dealers adopted them first because pricing accuracy maps directly to gross on units already in stock.
AI-driven sourcing and acquisition tools tell a different story, and their adoption trails pricing tools by a wide margin. An estimated 24% of franchise dealers and 14% of independents used an AI-native acquisition platform in 2025, less than half the rate of pricing-tool adoption. The gap exists because pricing tools improve an established workflow, while acquisition tools ask a used car manager to change where inventory comes from. Because that is a harder operational shift, platforms built for direct sourcing, including AutoAcquire, entered dealer stacks later than valuation software. Lotlinx sits in a related but distinct category, using AI to target marketing spend at individual VINs already in stock rather than sourcing new units.
The adoption gap between leaders and laggards concentrates in this second category. Dealer groups running AI acquisition tools reported sourcing 30% to 45% of their used inventory outside traditional auction lanes, compared with under 15% for dealers relying on pricing tools alone. Acquisition adoption predicts the sourcing-mix shift covered next, because a dealer cannot meaningfully move volume from Manheim or ACV Auctions to the service drive without a system that generates and appraises seller leads. AutoAcquire operates in this second category through AVA and iOffer, turning service drive customers and private-party owners into sourced units.
To forecast where a market is heading, track acquisition-tool adoption rather than pricing-tool adoption. Pricing adoption tells you how dealers optimize the inventory they already own. Acquisition adoption tells you how they intend to fill the lot next quarter.
The sourcing mix shift: away from auctions, toward service drive and direct-to-consumer
Dealers have made their largest sourcing change in three years by reallocating away from wholesale auction lanes. They pulled roughly 11 to 12 percentage points of their used inventory out of auction channels between 2022 and 2025, redirecting that volume toward service drive acquisition and direct private-party buys. Auction lanes still supply the plurality of used units for most rooftops, but the trend line points consistently downward, and independent dealers have moved faster than franchise groups.
Rising transaction costs explain most of the shift. A single Manheim or ADESA purchase now carries buy fees, transportation, reconditioning, and arbitration risk that can add several hundred dollars per unit before a car ever hits the lot. When gross margins on used vehicles compressed after the 2021 pricing peak, those fixed acquisition costs consumed a larger share of a shrinking spread. Dealers responded by sourcing units they could touch and appraise before buying, which meant looking at the cars already driving through their own service lanes.
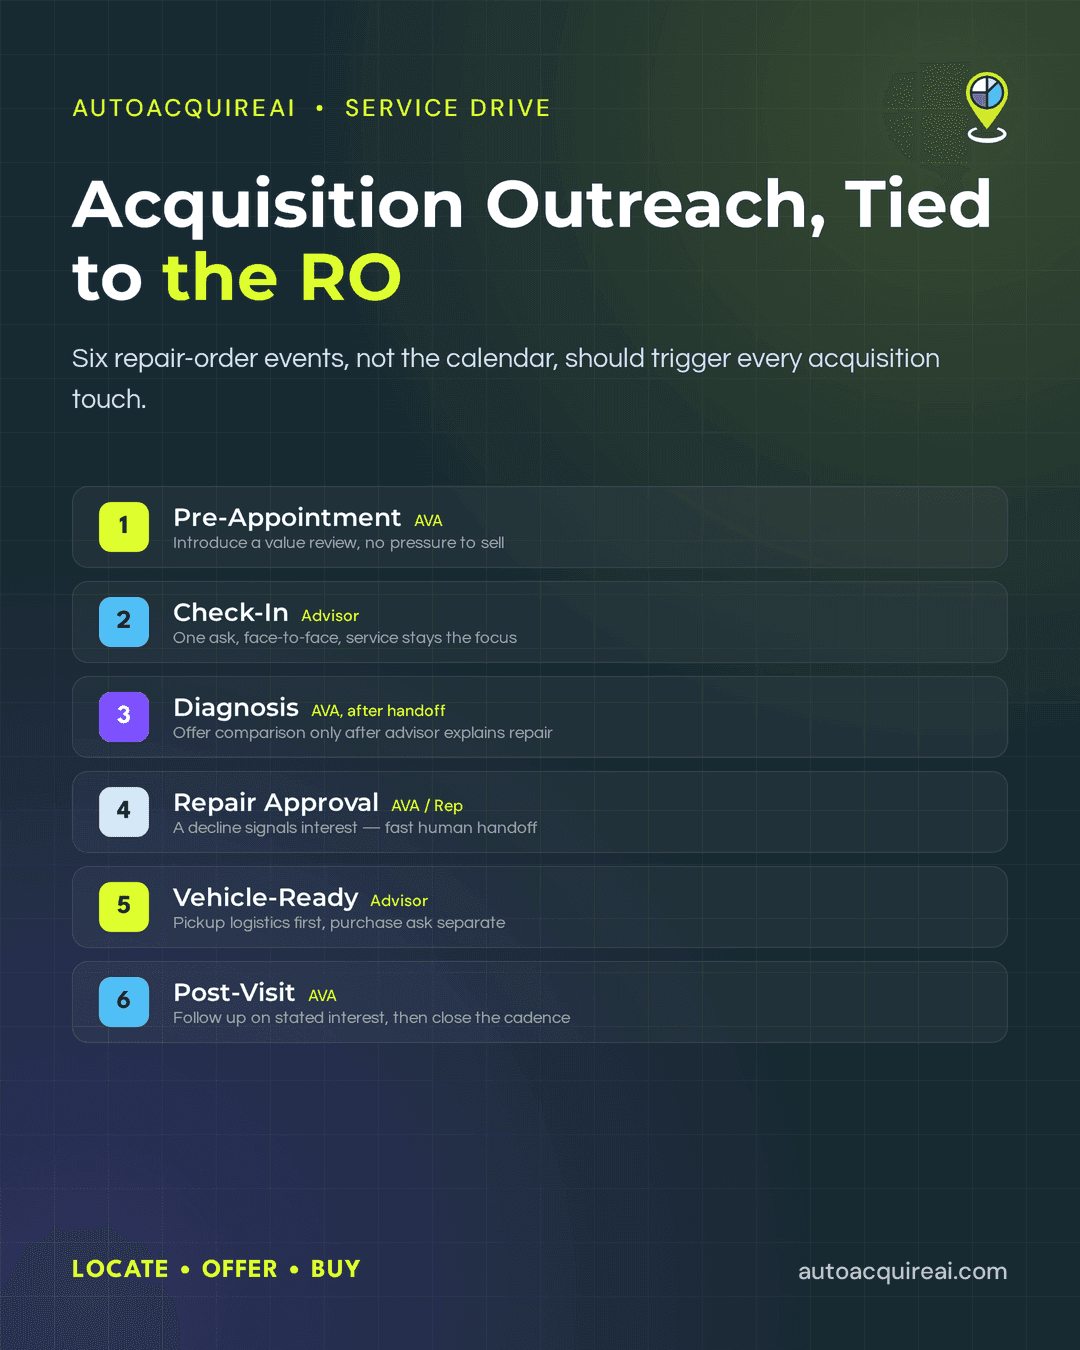
Service drive acquisition changed the math because the dealer owns the customer relationship and the vehicle history. A car serviced at the same store often comes with known maintenance records, no transport cost, and a seller who already trusts the brand. Direct private-party acquisition works on similar logic. The dealer buys closer to the retail source, skips the wholesale markup, and captures the margin that would otherwise go to the auction and the transport carrier.
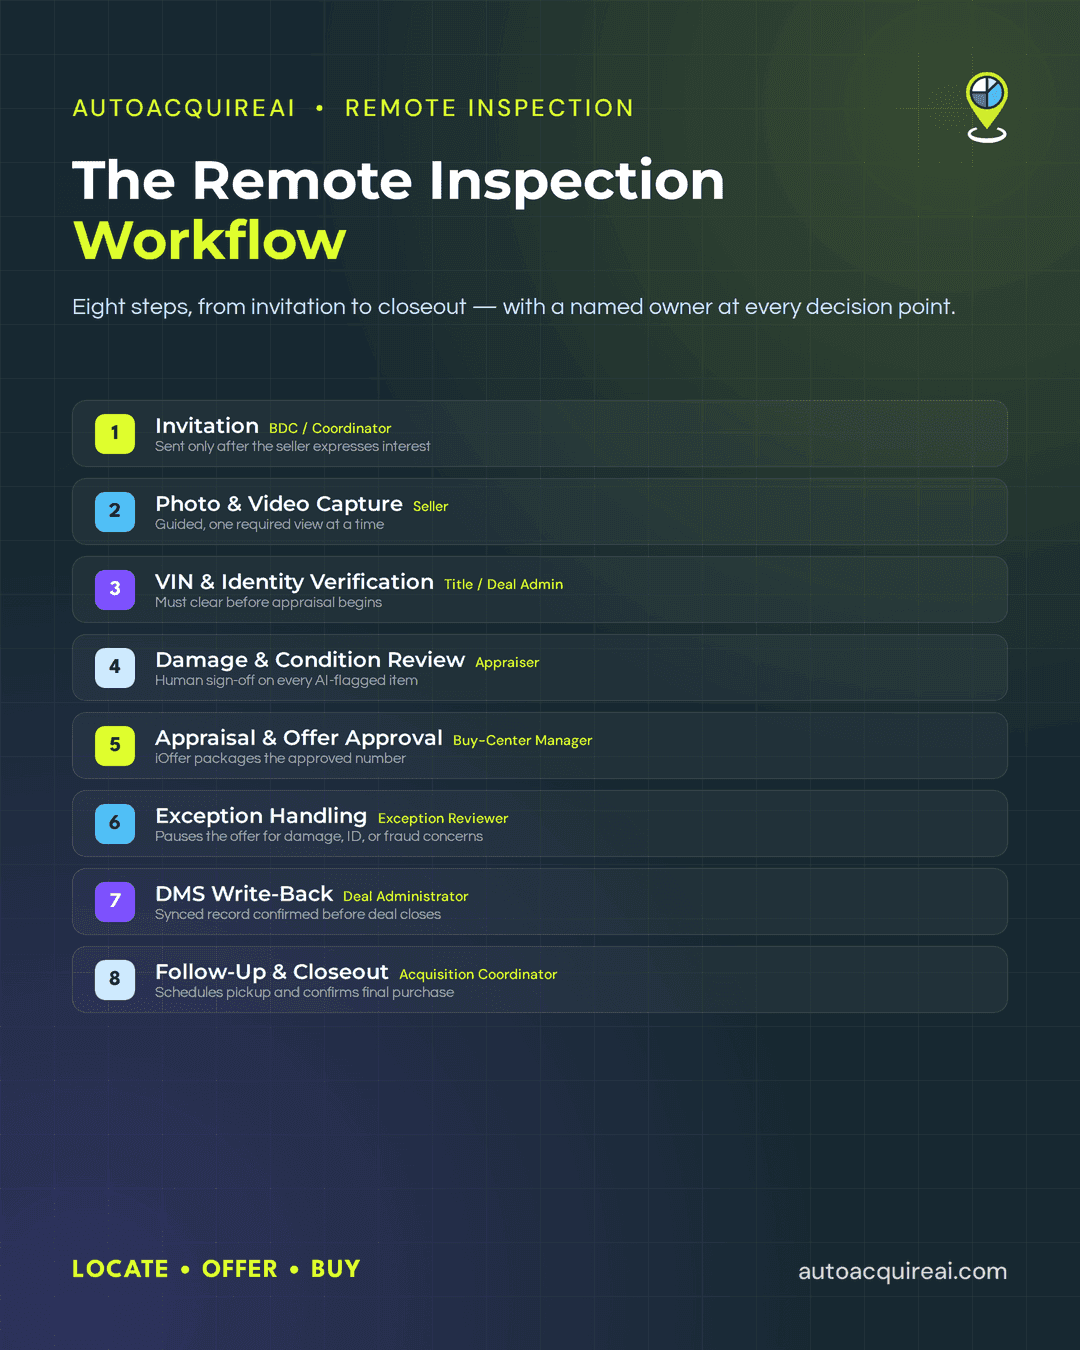
Executing that shift at volume requires tooling built for outreach and appraisal rather than lot management. Most DMS platforms track inventory a dealer already owns. Auction marketplaces sell units the dealer must transport and recondition. Neither category generates seller leads from the service drive or the private-party market. AutoAcquire fills that layer with AVA for automated seller outreach, iOffer for instant cash offers, and Remote Inspection for appraising private-party vehicles without a lot visit. AutoAcquire sits alongside a dealer's existing DMS and auction accounts rather than replacing either.
The dealers moving fastest on this reallocation are the ones treating acquisition as its own discipline with its own software. They still buy at auction when the right unit appears, but they no longer treat wholesale lanes as the default. The 12-point reallocation reflects a structural response to fee pressure that is unlikely to reverse while used-car margins stay thin.
Where DMS, auctions, and acquisition-native tools fit
Dealers run three distinct tool categories across the inventory lifecycle, and confusing them leads to overpaying for overlap or leaving gaps in the workflow. A dealer management system tracks and prices inventory a store already owns. An auction platform sources vehicles wholesale at a per-unit fee. An acquisition-native layer generates seller leads and closes deals directly with consumers before a car ever hits an auction lane.
| Category | Example Platforms | Primary Role | Best For | Auction Fee Exposure |
|---|---|---|---|---|
| DMS / inventory management | CDK, Dealertrack, DealerSocket | Track, price, and manage owned inventory | Franchise groups needing DMS-native workflows | None (system of record) |
| Auction platforms | Manheim, OPENLANE, ACV Auctions | Source vehicles wholesale | Dealers filling gaps fast at scale | High (buy/sell fees per unit) |
| Acquisition-native | AutoAcquire (AVA, iOffer, Remote Inspection) | Source directly from service drive and private sellers | Dealers reducing auction dependence | None (direct-to-consumer) |
Franchise groups running multiple rooftops lean on CDK, Dealertrack, or DealerSocket because a DMS keeps pricing, accounting, and inventory records in one system of record no acquisition tool replaces.
Dealers who need volume fast still buy at Manheim, OPENLANE, or ACV Auctions, where thousands of units clear daily. The tradeoff is per-unit fees that compress margin on every purchase.
Dealers cutting auction spend use an acquisition-native layer to close deals with service customers and private sellers. AutoAcquire runs AVA for outreach, iOffer for instant cash offers, and Remote Inspection for condition capture, feeding those units back into the DMS without a lane fee attached.
Multi-rooftop groups centralize acquisition across stores so each rooftop sources from a shared pipeline rather than competing at the same auction.
For a tool-by-tool breakdown across all three categories, see the best dealership inventory management tools comparison.
What these trends mean for dealers in 2026
Competitive advantage in used car retail is moving toward dealers who control where their inventory comes from. The four findings in this study point in the same direction. Franchise dealers turning stock faster than independent stores, holding costs that accelerate sharply past 60 days, AI adoption climbing among top operators, and a measurable reallocation of sourcing away from auction lanes all reward the same behavior. Dealers who source closer to the retail transaction win on cost and speed.
The turn-time gap and the holding-cost curve explain each other. A vehicle acquired at a lower cost basis and priced to retail quickly never enters the expensive tail of the depreciation curve. Auction-sourced units carry fees and transport time that push them toward that tail before they hit the lot. Direct acquisition from service drive customers and private sellers shortens that clock.
AI adoption leads the sourcing reallocation rather than forming a separate trend. Dealers adopting AI pricing and acquisition tools are the same ones expanding direct sourcing, because the tools make private-party and service drive acquisition operationally feasible at volume.
For dealer principals planning 2026 sourcing, the decision is less about which auction to buy from and more about how much inventory to originate directly. Operators who build that capability now, using an acquisition-native layer like AutoAcquire, hold a structural cost advantage as auction margins keep compressing.
Citable stat summary
Every figure below is drawn from AutoAcquire's 2026 benchmark study, a modeled analysis described in the methodology section above. Each line is written to stand alone for direct quotation, with attribution to this study rather than to any single external data provider.
Turn times
- Franchise dealers turned used inventory in an average of 38 days, compared to 52 days for independent dealers, a 14-day gap.
- Buy-here-pay-here independents averaged the slowest turn at roughly 60 days or more, while franchise used departments ran fastest at 34 to 38 days.
Holding cost
- Aging inventory costs dealers an estimated $32 to $45 per unit per day once floor plan interest, depreciation, and reconditioning drag are combined.
- Depreciation accelerates sharply after the 30-day mark, with units past 90 days losing value roughly twice as fast per day as units under 30 days.
- A single 60-day-old vehicle carries an estimated $1,900 to $2,400 in accumulated holding cost before it sells.
AI adoption
- Roughly 61% of franchise dealers used AI-driven pricing or appraisal tools by the end of 2025, against about 41% of independents.
- AI-driven acquisition and sourcing tools reached far lower penetration, with an estimated 24% of franchise dealers using them, marking the widest leader-to-laggard gap in the study.
Sourcing mix
- Auction lanes fell from roughly 55% of used inventory sourcing in 2022 to an estimated 43% in 2025, an 11-point decline.
- Service drive and direct-to-consumer acquisition grew by an estimated 9 percentage points over the same period as auction fees and margin compression pushed dealers toward direct channels.
Suggested citation: AutoAcquire Dealership Inventory Management Trends 2026 Study (modeled industry benchmark), AutoAcquire, 2026.
FAQs
Why are dealers moving away from auction lanes? Rising auction fees and thinner margins on auction-sourced units are pushing dealers toward direct channels. AutoAcquire supports that shift as an acquisition-native layer, sourcing units from service drive customers and private sellers through AVA and iOffer. Dealers gain lower per-unit acquisition cost and better control over which vehicles enter inventory.
What counts as aging inventory in this study? Aging inventory is any used unit that has sat on the lot past 60 days, the point where depreciation and holding-cost acceleration become material. AutoAcquire helps dealers replace that slow-turning stock with directly sourced units through AVA, iOffer, and Remote Inspection. The benefit is faster turn, which reduces the depreciation drag quantified in the holding-cost figures.
How is AI adoption measured here? Adoption reflects the share of surveyed dealers using AI-driven pricing, appraisal, or acquisition tools in active workflows, not trial or evaluation use. AutoAcquire falls in the acquisition category through its AI-powered instant cash offer and Remote Inspection features. The distinction matters because pricing tools and sourcing tools are separate buying decisions with different adoption curves.