
Service Drive Vehicle Acquisition ROI Scorecard: Conversion Metrics and Cost per Car
TL;DR
- Measure service-drive acquisition by intake cohort, from targeted vehicles through completed purchases. Track sourcing cost per purchased vehicle separately from gross and days-to-turn after retail sale.
- The worked example is illustrative, not an audited industry benchmark.
- Dealers need DMS and accounting records to finalize purchased-unit counts, costs, realized gross, and sale dates.
- AutoAcquire supports service-drive sourcing. Its AVA outreach and iOffer offer workflow can supply funnel activity, but dealers must calculate rates and reconcile purchases and financial results to DMS and accounting records.
Defining the service-drive acquisition funnel
Count distinct vehicle acquisition opportunities, not calls, messages, or customer records, at every funnel stage. Assign each opportunity to an intake cohort when a store first selects the vehicle for service-drive acquisition. Record the first qualifying date for each stage and retain repeat activity separately. For the stage-to-stage rates below, count an opportunity at a later stage only if it reached every preceding stage.
- Targeted service vehicle. A store selects an identified vehicle from a service appointment or visit for a potential purchase discussion. Exclude duplicate VIN entries, vehicles already owned by the dealer, and vehicles selected solely for a retail sales lead.
- Eligible/consented contact. The store has a reachable customer associated with the targeted vehicle and records the permission required for the proposed outreach channel under applicable rules. Exclude missing or invalid contact details, opt-outs, and contacts whose permission does not cover that channel. Eligibility does not mean the store sent a message.
- Outreach response. The customer replies to, answers, or otherwise engages with acquisition outreach about the vehicle. Count the vehicle once after a recorded response, regardless of how many calls or messages preceded it. Do not count delivery receipts or unanswered calls.
- Appraisal. The store records a vehicle-specific valuation after gathering enough identity, condition, and history information to support a proposed purchase price. An unreviewed pricing alert or generic estimate does not count.
- Offer. The store communicates a specific purchase amount and its relevant conditions to the customer. A completed appraisal that never reaches the customer does not count as an offer.
- Accepted offer. The customer explicitly agrees to the communicated amount and conditions. Interest in getting an offer does not count as acceptance.
- Purchased vehicle. The store completes the acquisition, takes ownership, and records the vehicle as purchased inventory in its DMS or accounting records. An accepted offer or unfinished transaction does not count. Apply a documented rule to transactions awaiting title so stores do not count them differently.
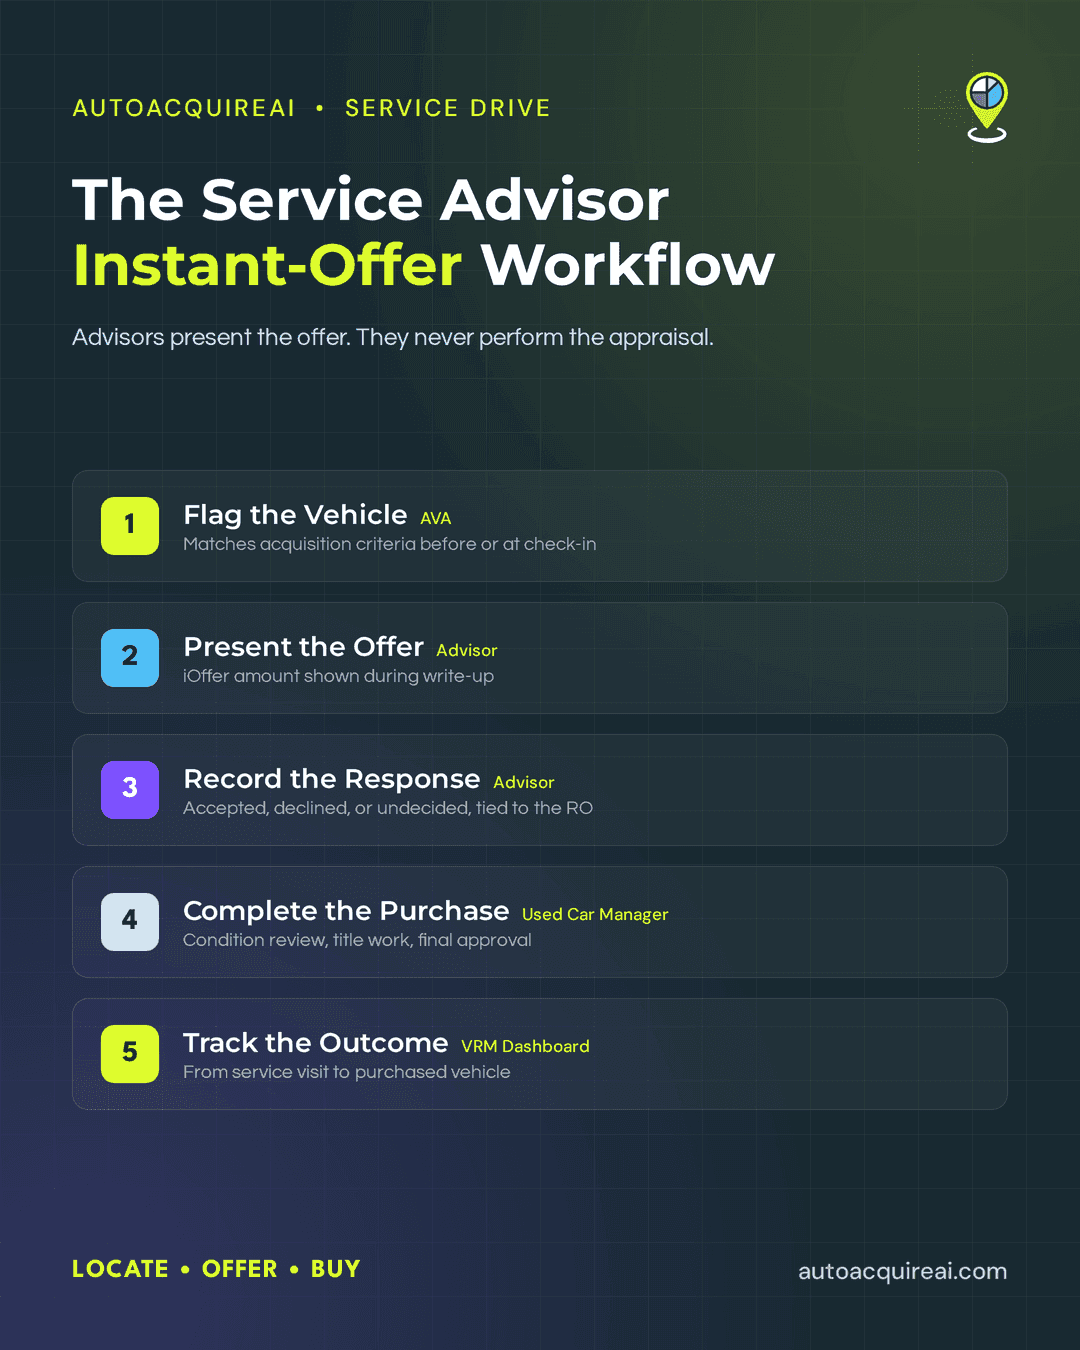
Within AutoAcquire’s service-drive acquisition workflow, AVA supports outreach to service customers, and iOffer supports instant cash offers. Dealers can use documented AVA attempts, customer responses, and communicated iOffer amounts as scorecard inputs. The dealership must retain the event dates and apply the same counting rules across stores.
Numerator/denominator formulas for each conversion rate
Calculate each rate for vehicles assigned to the same intake cohort, such as vehicles first targeted during one calendar week at one store. Use a common reporting cutoff for every numerator and denominator. For example, a 30-day view of an intake week counts stages each opportunity reaches within 30 calendar days of its own intake date. Publish that view only after every vehicle in the intake week has had 30 days of follow-up. Keep vehicles still in progress visible as pending, and label rates as of the cutoff rather than treating them as final.
- Contact rate = eligible/consented contacts ÷ targeted service vehicles × 100%. Here, contact rate measures the share permitted and reachable for outreach. It does not measure messages sent or successfully delivered.
- Response rate = vehicles with an outreach response ÷ eligible/consented contacts × 100%. Eligible vehicles with no outreach attempt remain in the denominator, so the rate reflects outreach coverage as well as customer response.
- Appraisal rate = vehicles appraised ÷ vehicles with an outreach response × 100%. Count an appraisal only after the store records the vehicle-specific valuation.
- Offer rate = vehicles receiving an offer ÷ vehicles appraised × 100%. Count a vehicle once even if the store revises its offer.
- Offer-acceptance rate = vehicles with an accepted offer ÷ vehicles receiving an offer × 100%. Use the customer’s recorded agreement date for the stage event.
- Purchase rate, or close rate = purchased vehicles ÷ vehicles with an accepted offer × 100%. Confirm purchases against the DMS or accounting record, not the offer log.
A purchase this week may trace back to a vehicle targeted last month. Keep the response, offer, and purchase in that vehicle's original intake cohort. Otherwise, this week's purchases divided by this week's accepted offers mixes different groups of vehicles and misstates the close rate.
Read a drop at each stage against the preceding count before changing the outreach plan. A low response rate may reflect missed outreach as well as unanswered messages, while a low purchase rate points to accepted offers that did not become booked inventory. Check the underlying activity and DMS records before assigning a cause.
Cohort and attribution rules
Assign each targeted vehicle to one intake cohort using the date the store first records its VIN as a service-drive acquisition target. Use the same cohort for every later funnel count, even when outreach or purchase occurs in a later week. A separate activity report can count calls and texts by outreach date, but those activity totals should not replace intake-based conversion denominators.
Give every intake cohort the same follow-up window, such as 30 days after each vehicle's intake date. Until all vehicles have reached that cutoff, label the cohort provisional. Deduplicate repeat appointments by VIN and acquisition opportunity. If an owner returns after the opportunity closes, open a new one only under a documented rule.
Count a vehicle once at each qualifying funnel stage, regardless of how many calls or texts it receives. Record AVA-initiated outreach and manual BDC follow-up as separate touch types. Attribute the vehicle to its originating service-drive opportunity at targeting, and record later AVA or manual contacts as touch types rather than new sourced vehicles. A response to a manual follow-up can then advance an AVA-initiated opportunity without creating a second response count.
For group reporting, assign one originating store to the opportunity and identify the purchasing store on the booked acquisition. Credit the originating store in the funnel report and identify the purchasing store in inventory receipts. An interstore transfer does not create another group purchase. Deduplicate group purchases by acquisition transaction and VIN so a later, separately documented purchase of the same vehicle is not silently discarded. Document how the group allocates acquisition expense when the two stores differ.
Acquisition cost per vehicle
Acquisition cost per vehicle measures sourcing expense per completed purchase, excluding the price paid for the vehicle. For a reporting month, calculate period acquisition cost per vehicle as total allocated service-drive acquisition program cost incurred in the month divided by service-drive vehicles purchased in that month. Mark the figure unavailable when the denominator is zero rather than reporting a cost of zero.
Include allocated platform fees, outreach charges, offer-generation costs, and staff time spent identifying targets, contacting owners, appraising vehicles, and closing purchases. Include pre-purchase inspection and other documented pursuit costs, including costs on unsuccessful opportunities. Classify any pre-purchase repair consistently with the dealer’s accounting policy and exclude it from the sourcing numerator if the dealer capitalizes it into vehicle cost. Record the vehicle purchase price separately as inventory cost. Charge post-purchase reconditioning and retail preparation to inventory or retail operations under the dealer's accounting policy, rather than silently adding them to the sourcing numerator.
Monthly spending and monthly purchases do not always arise from the same intake cohorts. A campaign paid for in January may produce a February purchase, so the monthly formula describes period spending per period purchase. For a cohort-based cost-per-vehicle analysis, allocate costs to intake cohorts and divide by purchases recorded within each cohort's stated observation window. Label these two views separately.
Fix the allocation method for shared software, management time, and overhead before comparing stores or months. Time records can allocate labor by hours, while a documented usage measure can allocate a shared platform bill. Count each invoice and hour once. For an auction comparison, use the same labor and overhead rules, then add auction buyer fees, transport, and other auction sourcing charges to the auction numerator. Compare sourcing cost per purchased unit separately from purchase price and subsequent recon cost.
Front-end gross and days-to-turn for service-drive acquisitions
Front-end gross becomes measurable when a sourced vehicle sells at retail. For each sold vehicle, calculate realized front-end gross as net retail selling price minus booked vehicle cost and any additional charges assigned to front-end gross under the dealer's accounting policy. Do not subtract a charge already included in booked cost. Booked cost may include the purchase price, transport, and capitalized reconditioning. Exclude finance and insurance income. If accounting already includes an acquisition charge in booked vehicle cost, do not subtract that charge a second time when evaluating profit.
Days-to-turn also depends on a retail sale. Calculate it as retail sale date minus vehicle purchase date, measured in calendar days. Report the average across vehicles sold in the period, and track still-unsold vehicles separately by current age. A vehicle purchased this month and sold next month belongs in this month's acquisition count but next month's sold-vehicle gross and turn figures.
Acquisition conversion rates end at purchase, while gross and turn describe what happened to purchased inventory afterward. Match each purchased VIN and purchase date to a DMS inventory receipt, then match allocated sourcing expenses to accounting entries. When that VIN sells, reconcile the sale date, booked vehicle cost, and posted front-end gross against the DMS and accounting ledger. The DMS integration checklist covers system handoffs, while these matches establish the scorecard totals. An accepted offer without a posted purchase cannot enter the purchased-unit denominator, and an unsold vehicle cannot contribute realized gross or completed days-to-turn.
Weekly and monthly scorecard template
Use one intake-cohort row per store and record the reporting cutoff and observation-window length with each snapshot. Update the row as vehicles move through the funnel. A vehicle targeted this week stays in this week’s cohort even if the dealer buys it next month. Weekly snapshots can show open cohorts, but final conversion rates need the same follow-up window at every store.
| Store | Intake week | Window (days) | Cutoff date | Status | Targeted | Eligible | Responded | Appraised | Offered | Accepted | Purchased | Contact % | Response % | Appraisal % | Offer % | Acceptance % | Close % |
|---|---|---|---|---|---|---|---|---|---|---|---|---|---|---|---|---|---|
| Store A | [date] | [ ] | [date] | [provisional/final] | [ ] | [ ] | [ ] | [ ] | [ ] | [ ] | [ ] | [ ] | [ ] | [ ] | [ ] | [ ] | [ ] |
| Store B | [date] | [ ] | [date] | [provisional/final] | [ ] | [ ] | [ ] | [ ] | [ ] | [ ] | [ ] | [ ] | [ ] | [ ] | [ ] | [ ] | |
| Group | [date] | [same window] | [date] | [provisional/final] | [sum] | [sum] | [sum] | [sum] | [sum] | [sum] | [sum] | [recalculate] | [recalculate] | [recalculate] | [recalculate] | [recalculate] | [recalculate] |
Each rate divides one stage by the preceding stage, starting with eligible contacts divided by targeted vehicles. The group row sums store counts and recalculates each rate from those totals. Averaging store percentages gives a different answer when stores have different cohort sizes.
Monthly financial reconciliation pairs period acquisition spending with purchases completed in that period. Report sale-month gross and turn separately because vehicles bought in one month may sell in another.
| Store | Reporting month | Period acquisition cost | Purchases in month | Cost per purchase | Sourced units sold in month | Realized front-end gross | Average days-to-turn | Unsold sourced units at month-end |
|---|---|---|---|---|---|---|---|---|
| Store A | [month] | [ ] | [ ] | [ ] | [ ] | [ ] | [ ] | [ ] |
| Store B | [month] | [ ] | [ ] | [ ] | [ ] | [ ] | [ ] | [ ] |
| Group | [month] | [sum] | [sum] | [recalculate] | [sum] | [sum] | [recalculate] | [sum] |
Divide acquisition costs assigned to the reporting month by vehicles purchased that month. Calculate intake-cohort cost per vehicle separately, using costs allocated to that cohort and purchases within its observation window. For the group, divide total allocated cost by total purchases rather than averaging store costs per vehicle. Calculate group average days-to-turn from the underlying sold vehicles, not from the store averages. Assign shared program costs once, and leave rates or averages blank when their denominators equal zero. The DMS and accounting records must confirm purchases, costs, sale dates, and realized gross before the monthly figures become final.
Worked illustrative example
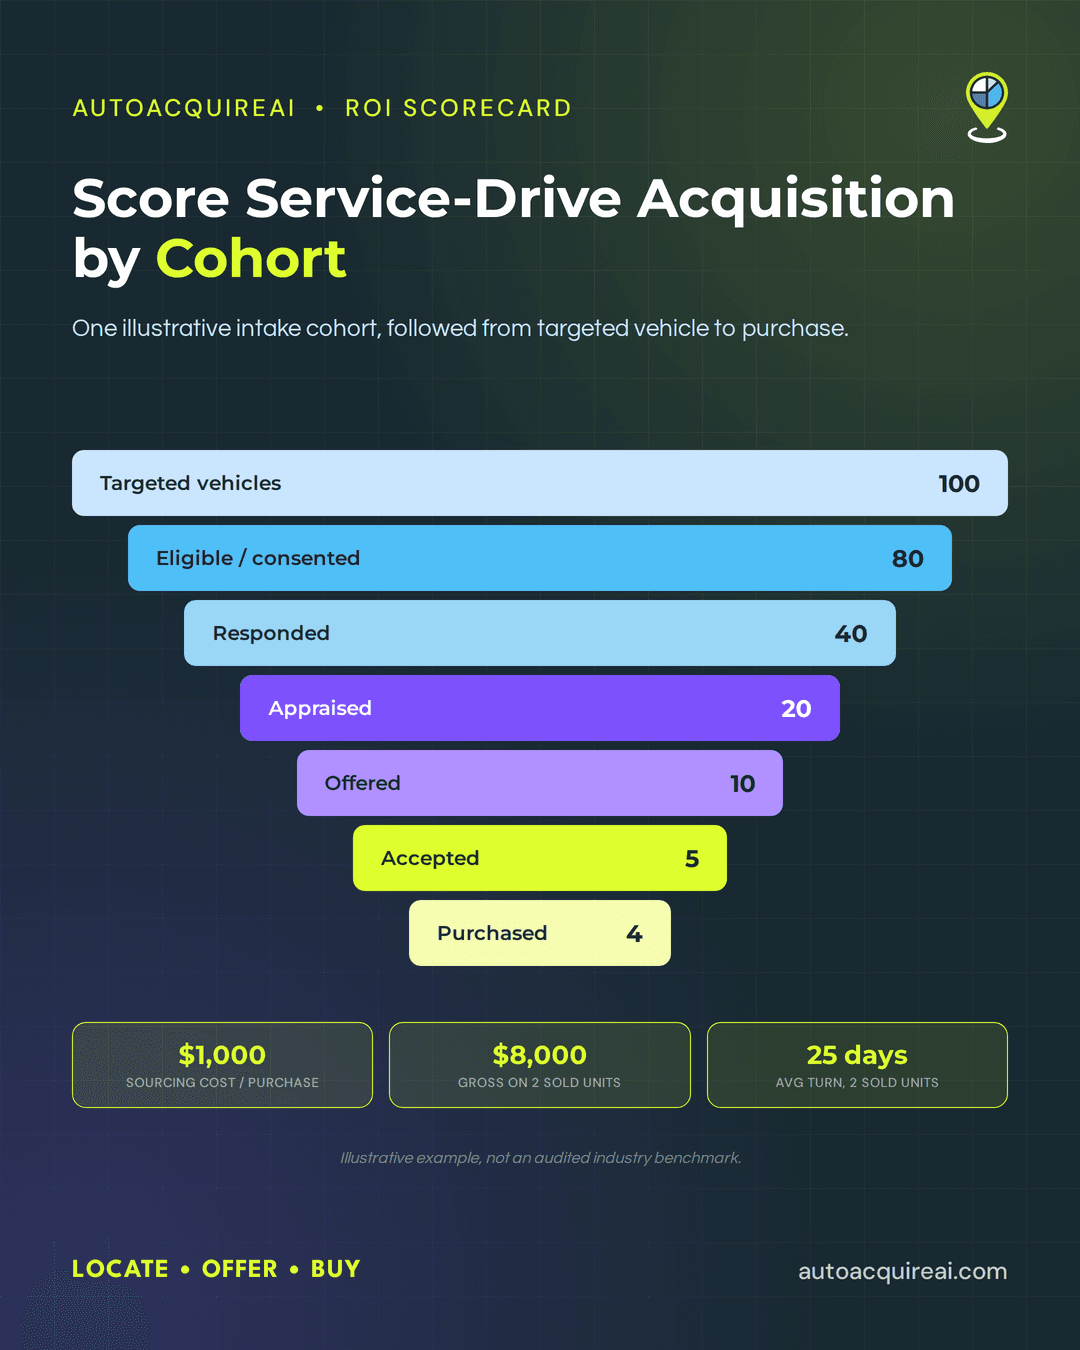
The following store example is illustrative, not an audited industry benchmark. One fictional intake cohort contains 100 targeted service vehicles. Of those, 80 have eligible contacts, 40 owners respond, 20 vehicles receive appraisals, 10 receive offers, five owners accept, and four vehicles are purchased.
| Conversion | Calculation | Rate |
|---|---|---|
| Contact | 80 eligible ÷ 100 targeted | 80% |
| Response | 40 responded ÷ 80 eligible | 50% |
| Appraisal | 20 appraised ÷ 40 responded | 50% |
| Offer | 10 offered ÷ 20 appraised | 50% |
| Acceptance | 5 accepted ÷ 10 offered | 50% |
| Close | 4 purchased ÷ 5 accepted | 80% |
After the cohort's stated observation window closes, the store assigns $4,000 in acquisition costs to it. Its fictional ledger includes $1,200 in allocated software fees, $1,600 in staff labor, $400 in outreach expense, and $800 in pre-purchase inspection costs. Acquisition cost per vehicle equals $4,000 ÷ four purchased vehicles, or $1,000. The vehicle purchase prices do not enter that sourcing-cost calculation.
Two of the four purchased vehicles later sell at retail for a combined $41,000. For those two sales, the fictional DMS records show $30,000 in vehicle purchase costs, $2,000 in post-purchase recon, and $1,000 in other front-end charges. Realized front-end gross equals $41,000 minus $30,000 minus $2,000 minus $1,000, or $8,000. Their purchase-to-sale intervals of 20 and 30 days produce a 25-day average days-to-turn. The other two vehicles remain unsold, so neither contributes realized gross or a completed turn time.
In an actual cohort, DMS inventory receipts would establish the four purchases, and posted sale and cost records would establish gross and turn for the two sold vehicles.
Service-drive versus auction acquisition cost comparison
Compare service-drive and auction costs using the same cost boundary and the same denominator. For each channel, divide its assigned sourcing costs by the vehicles purchased through that channel during the reporting period. Keep vehicle purchase prices separate from sourcing costs so differences in inventory mix do not look like differences in acquisition efficiency.
| Cost component | Service drive | Auction |
|---|---|---|
| Channel expense | Outreach, platform fees, and offer-related charges | Buyer fees and auction-related charges |
| Labor | Staff time spent targeting, contacting, appraising, and closing sellers | Buyer time spent searching, bidding, and closing purchases |
| Logistics and pre-purchase costs | Actual transport and documented pre-purchase expenses | Actual transport, condition-report, and arbitration expenses |
| Recon | Actual recon cost, reported separately | Actual recon cost, reported separately |
Sourcing cost per purchased vehicle equals channel expenses plus allocated labor, logistics, and documented pre-purchase expenses, divided by purchased vehicles. Allocate costs for unsuccessful outreach and unsuccessful auction bids to the channel that incurred them. Dealers should use a documented allocation method for shared staff and software costs, then apply it consistently across stores and months.
Recon needs its own line in the comparison because most recon follows purchase. Dealers can compare total cost through retail readiness per vehicle by adding purchase price and actual post-purchase recon to each purchased vehicle's allocated sourcing cost. They should not count recon once in sourcing cost and again in landed cost. Likewise, dealers should record actual auction arbitration costs rather than treating a possible claim as an expense.
The difference in sourcing cost per purchased vehicle equals auction sourcing cost per vehicle minus service-drive sourcing cost per vehicle under the same cost boundary. Compare vehicle mix and retail results separately before treating a positive difference as an economic advantage. Differences in vehicle mix, staffing, fees, transport, and recon can change the comparison across stores and markets.
Where AutoAcquire fits in the measurement workflow
AutoAcquire supports direct vehicle acquisition from service customers, but its outreach and offer activity are inputs to the scorecard rather than verified ROI reporting. AVA can carry out approved outreach to targeted service customers. The scorecard should count a contact only when the customer meets the dealer’s eligibility and consent rules, and count a response only when the customer actually replies. An attempted call or sent message does not establish either event.
iOffer supports the instant cash offer step after vehicle evaluation. For measurement, dealers should record when an offer reaches the customer, when the customer accepts it, and when the dealership completes the purchase as separate events. A generated offer that the customer never receives should not enter the offer count, and an accepted offer should not enter the purchased-vehicle count.
Dealers can enter documented AVA and iOffer events into a manual or separately built scorecard, then allocate costs and calculate cohort rates. DMS inventory receipts and accounting records establish completed purchases, expenses, and eventual retail gross.
FAQs
What counts as a purchased vehicle rather than an accepted offer? An accepted offer records the seller’s agreement to a proposed price. Count a purchased vehicle only after the dealer completes the transaction, takes ownership, and records the unit in the DMS. Count each vehicle once, even if staff revise its offer.
How should a dealer calculate acquisition cost per vehicle, including labor? Add service-drive software fees, outreach expenses, offer-related costs, allocated staff labor, and documented pre-purchase pursuit costs. Keep capitalized repairs and post-purchase reconditioning out of the sourcing-cost numerator. Divide that total by vehicles purchased through the service-drive cohort. Document how the dealer assigns shared labor and fees so monthly results remain comparable.
How does days-to-turn differ from acquisition cost? Acquisition cost measures sourcing expense per purchased vehicle. Days-to-turn counts calendar days between the purchase date and the retail sale date. A vehicle enters the cost calculation when purchased, but it cannot have a final days-to-turn figure until it sells.
How should a dealer group roll up per-store conversion rates? Sum each store’s numerator and denominator for the same cohort and reporting window, then divide the group totals. Do not average store percentages. A store with 100 eligible contacts should carry more weight than a store with 10.
Why must front-end gross reconcile to the DMS? The acquisition scorecard tracks how a dealer sourced a vehicle, but it does not establish the final retail sale price or posted vehicle costs. Reconcile gross to DMS and accounting records after sale, including applicable reconditioning charges and adjustments under the dealer’s accounting policy.
Conclusion
Use the same cost boundary and purchased-unit denominator to compare service-drive sourcing with auctions. Keep cohort conversion separate from sale-month gross and turn. AutoAcquire AVA outreach and iOffer offer activity can supply funnel inputs; DMS and accounting records establish completed purchases, costs, and retail results.